這個專案已安排上線
上線時間:Saturday, May 30, 2026 08:00 AM UTC
已排程
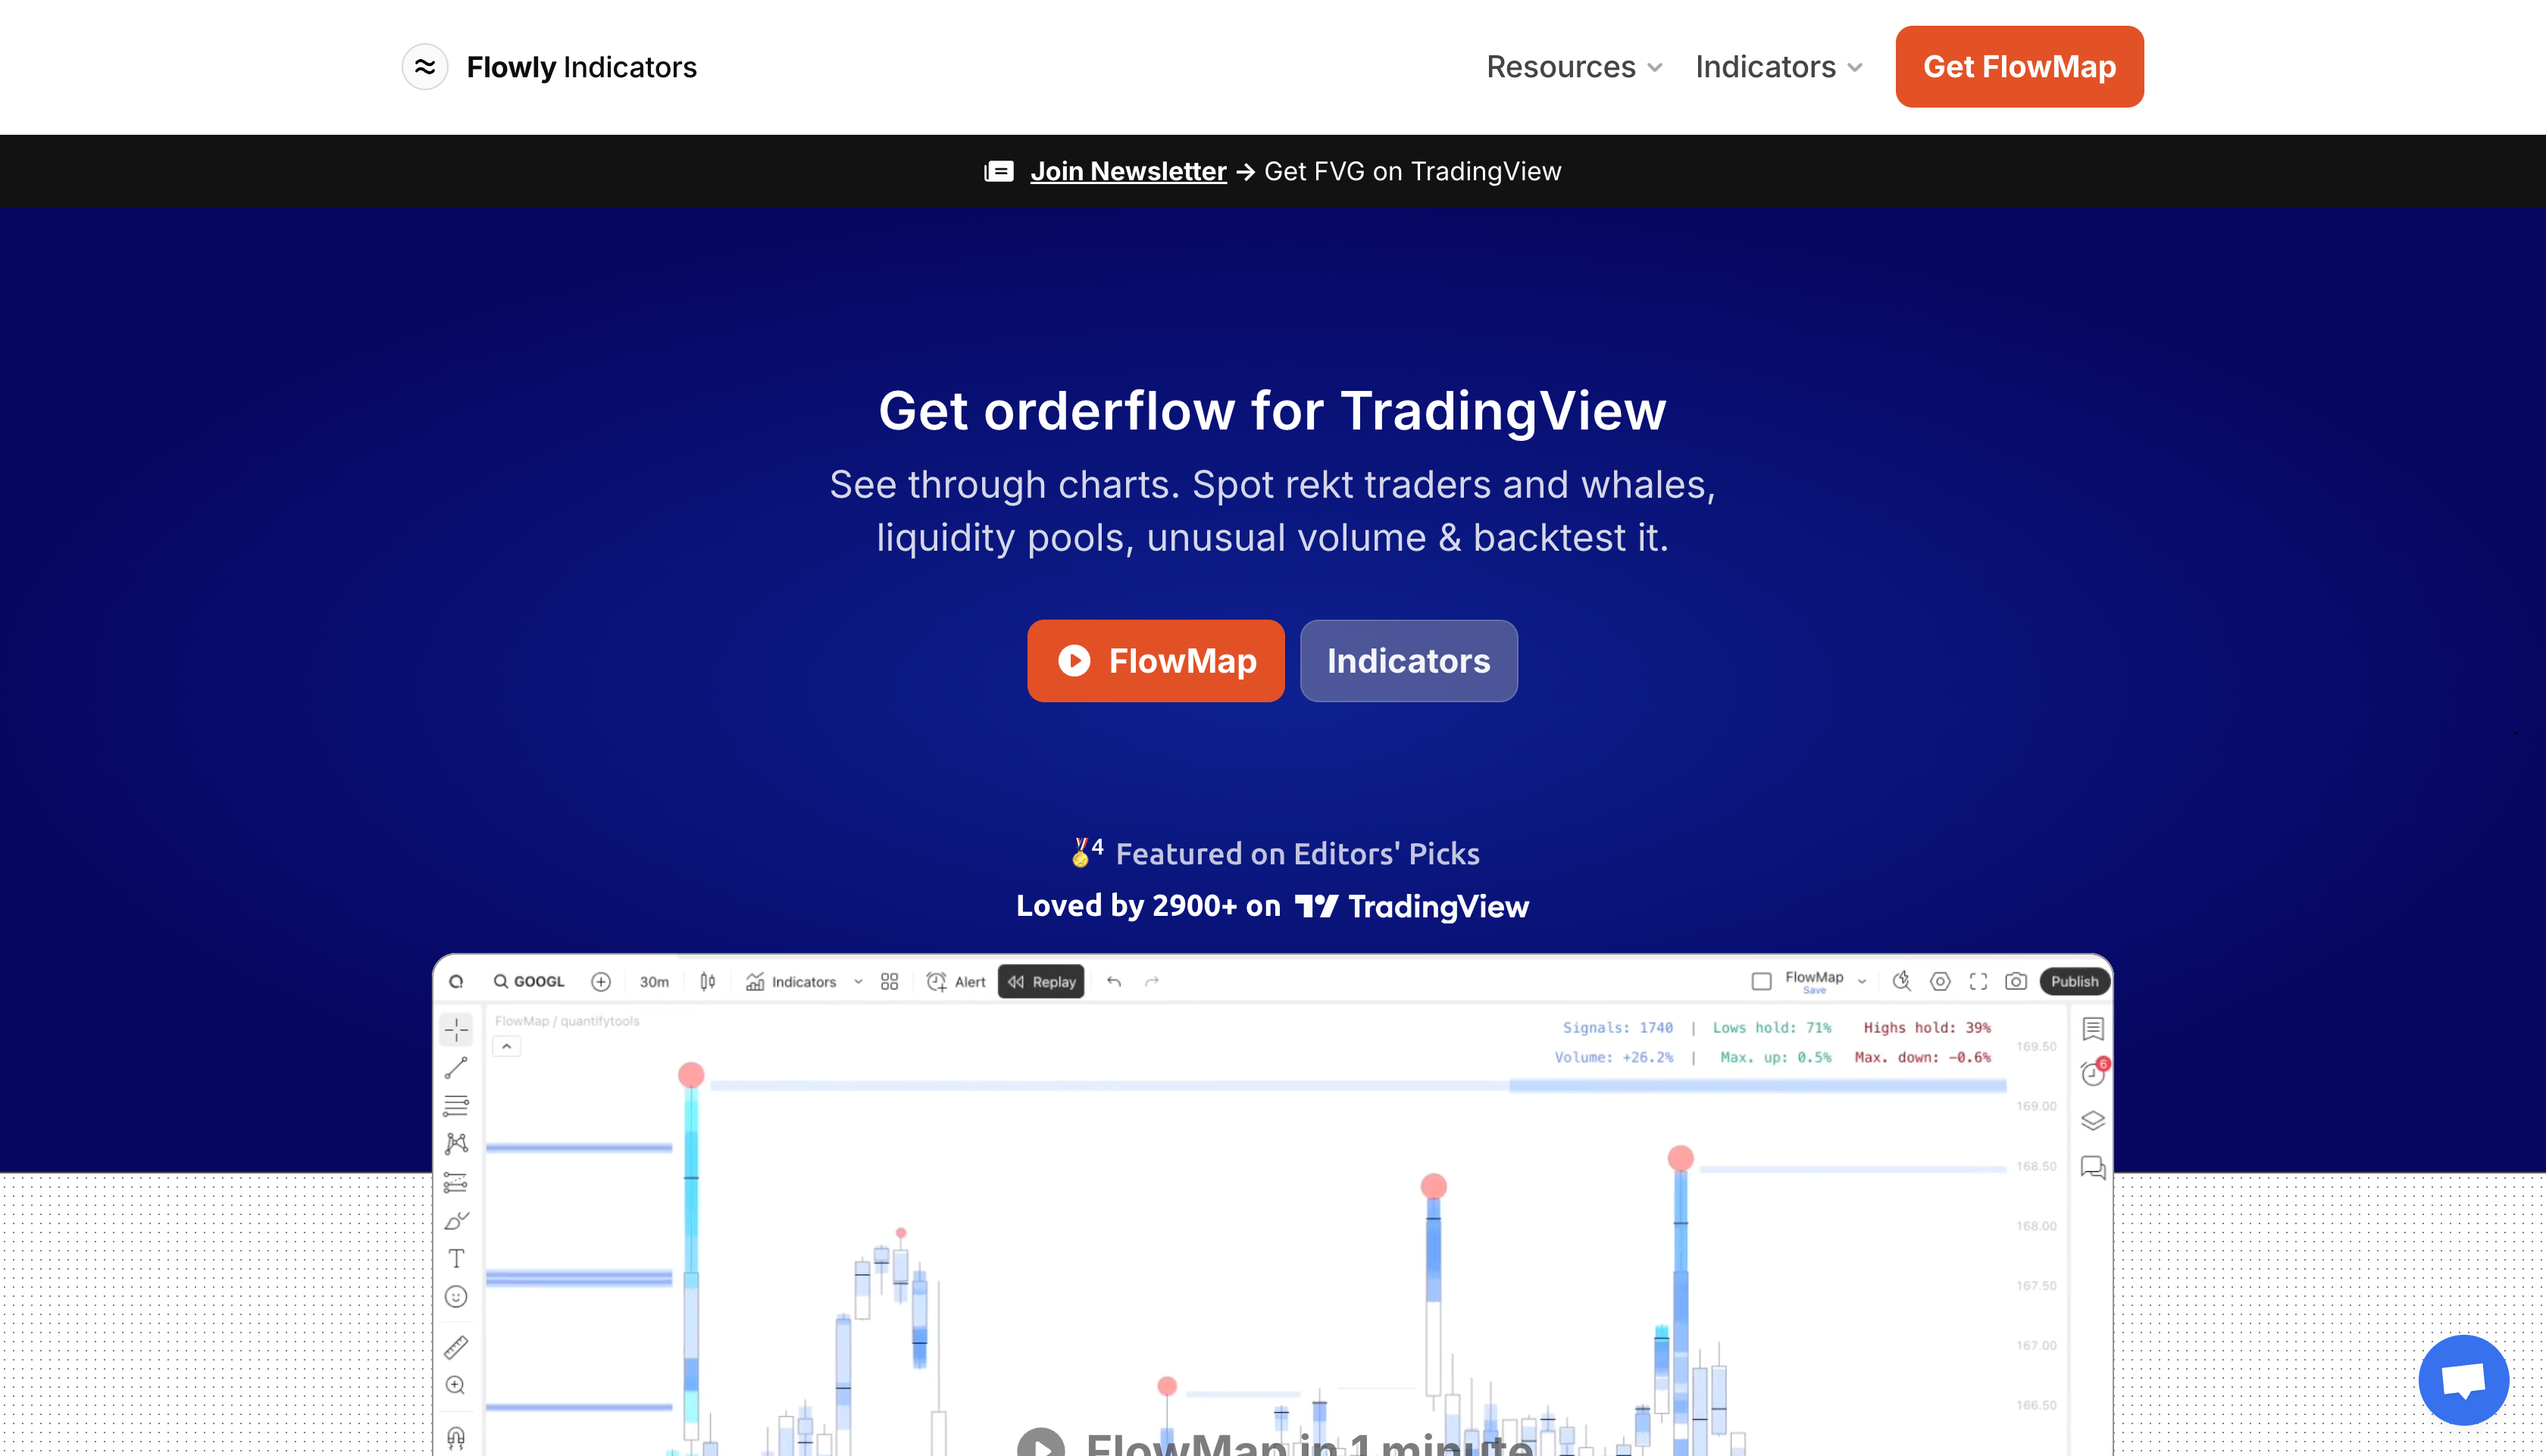
An algorithmic orderflow tool for TradingView that visualizes volume concepts like liquidity, liquidations, and unusual activity.
詳細資訊
Overview
FlowMap is an algorithmic orderflow tool designed specifically for TradingView that integrates multiple key volume analysis concepts into a single indicator. It helps traders visualize what happens beneath the surface of price charts by revealing order flow dynamics, liquidity pools, and market participant behavior. The tool is rooted in Auction Market Theory and provides evidence-based insights through volume and price impact metrics. FlowMap works across all markets and timeframes available on TradingView, requiring no complex setup—users can start using it immediately after installation.
Key Highlights
- Comprehensive Orderflow Analysis: Combines liquidity heatmaps, internal flow, liquidations, value area, point of control (POC), and backtesting capabilities in one tool.
- Theory-Backed Concepts: Based on Auction Market Theory, enabling analysis of resting limit orders, unusual volume, rekt traders, key flows and levels, and volume/price impact.
- Plug-and-Play Functionality: Works on all TradingView markets (stocks, indices, commodities, crypto, metals, currencies) and all timeframes without additional configuration.
- Backtesting Capabilities: Provides evidence-based insights with historical volume and price impact metrics for validating trade ideas.
- Market Scanning: Saves time by scanning multiple markets simultaneously for volume events.
- Instant Access: Users can get started quickly with a 15-minute learning curve.
- Custom Alerts: Allows building custom alerts with multiple conditions and email notifications.
- Risk-Free Trial: Offers a 30-day money-back guarantee with no questions asked if users are not satisfied.
- Community Validation: Featured on TradingView's Editors' Picks and loved by over 3,200 traders with positive user testimonials.
Use Cases
- Spotting Market Inefficiencies: Identify rekt traders, whale activity, and liquidity pools that aren't visible on standard price charts.
- Trade Validation: Backtest trading ideas using historical volume and price impact data to confirm setups before execution.
- Multi-Market Monitoring: Scan hundreds of charts simultaneously for unusual volume events or specific orderflow patterns.
- Educational Analysis: Learn orderflow concepts through visual representations of resting limit orders, value areas, and point of control.
- Alert-Based Trading: Set up custom alerts for specific conditions (like unusual volume or liquidation clusters) to get notified via email.
FAQ
What is FlowMap? FlowMap is an algorithmic orderflow tool for TradingView that visualizes key volume concepts like liquidity heatmaps, internal flow, liquidations, and value areas.
What markets does it work on? It works on all markets available on TradingView including stocks, indices, commodities, crypto, metals, and currencies across all timeframes.
How quickly can I start using it? The tool is designed for quick learning—users can typically get started within 15 minutes of installation.
Is there a trial period? Yes, there's a 30-day money-back guarantee if you're not satisfied with the product.
Does it require a TradingView subscription? Yes, a TradingView plan is required to use FlowMap (as indicated by the asterisk note about scanning functionality).
What support is available? Priority support is included with the tool.
Pricing
| Plan | Price | Billing | Savings | Features |
|---|---|---|---|---|
| Annual | $20/month + VAT | Annually | Save 50% | FlowMap Indicator, FlowMap Lessons, Priority Support |
| Monthly | Not specified | Monthly | Not specified | FlowMap Indicator, FlowMap Lessons, Priority Support |
Both plans include the 30-day money-back guarantee.
評分與評論
4.00 ratings
留言
發布者

Miro Tanninen
上線日期2026/5/30
平台web
價格free